

Benchmarking the profitability
of raising pigs 2023
Dr. Derald Holtkamp, Dr. Lee Schulz and Dr. Dermot Hayes, Iowa State University (USA).
Using 2023 Data
Country comparisons and factors contributing to their relative advantage or disadvantage in a global market.
Conclusions
- If we compare pork producers based on profitability, as we do when we evaluate companies, then Spain, Belgium, Italy, and the Netherlands come out on top in 2023.
- If we use animal husbandry and productivity as a performance measure, then Denmark, the Netherlands, Belgium and the Czech Republic rank at the top.
- Using production costs as a metric, Brazil is the most competitive.
- Relatively low productivity in the USA is a persistent competitive disadvantage for producers there.
Comparisons 2023
versus 2022
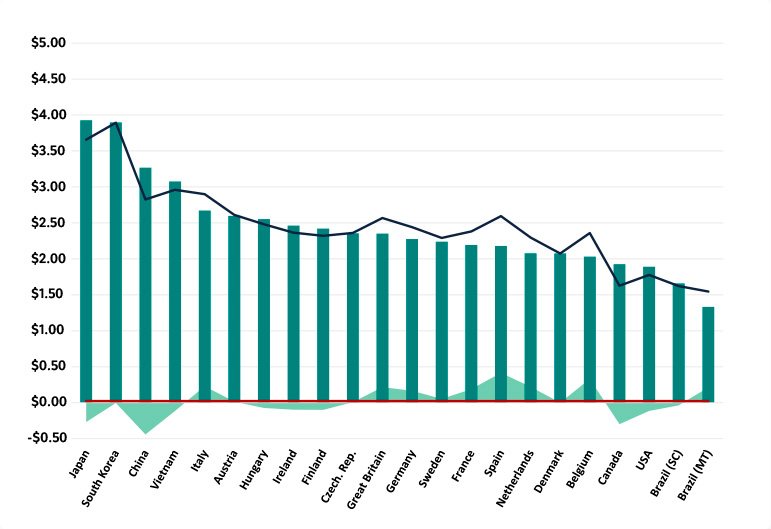
- 2023 was a good year in most of Europe compared to 2022, and a bad one in China and the USA.
- The simple average of profitability across all countries year-over-year increased by US$0.28 per kg of carcass weight as feed prices fell and market pig prices increased in Europe and Brazil but fell in Asia and North America.

Productivity:
- Producers in Denmark had the highest productivity.
- Producers in Japan had the lowest productivity.
Production
costs:
- Japan and South Korea had the highest production costs per kg of pork sold. China and Vietnam also had very high production costs.
- Brazil, the USA, and Canada had the lowest overall costs. Brazil is now the world’s low-cost supplier.
Feed
prices:
- Producers in Japan had the highest feed prices.
- Lowest feed prices were observed in Brazil (MT).
Market
pig prices:
- Highest market pig prices were obtained in South Korea and Japan.
- Brazil (MT and SC), the USA and Canada lost out in this regard.
Profit:
- Net profit was positive or near breakeven in most countries in Europe and Brazil.
- Losses were incurred in Japan, China, Canada and the USA.
Revenue, cost, and profit per carcass kg sold – 2023.

Profit advantage of select factors, all other variables held constant, US$ per carcass kg sold basis, 2023.
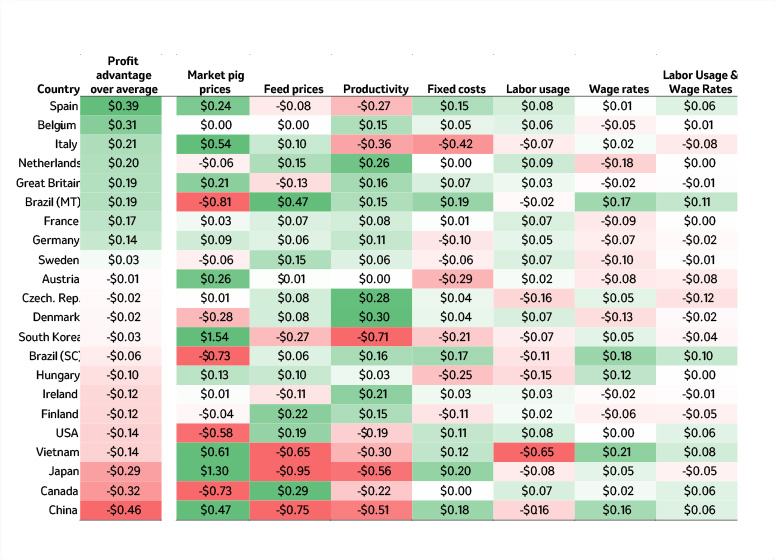
Note: Each factor was evaluated alone, one at a time. Therefore, any differences in profitability are due strictly to the country’s differences in the values for that factor. For each factor, the relative advantage or disadvantage is reported as the difference in profitability relative to a hypothetical country with average values for the factor evaluated. An advantage (disadvantage) is reported as a positive (negative) contribution to profitability above (below) the hypothetical average country.