

Benchmarking the cost of raising pigs
Dr. Derald Holtkamp, MS, DVM, Professor of Veterinary Diagnostic and Production Animal Medicine, Iowa State Univ. (USA)
Benchmarking the cost of raising pigs: Country comparisons and factors contributing to their relative advantage or disadvantage in a global market.
Despite recent nationalistic tendencies, the global pandemic, and other trends working against global trade, pork producers are not insulated from competition with producers in other countries. In a July 2020 report on world markets and trade of livestock and poultry, the United States Department of Agriculture’s Foreign Agricultural Service estimated that 10.9 million tons of pork will be exported in 2020 . Pork producers around the world are competing in a global market. While that market can, and is, distorted by politics and trade relations, the global competitiveness of individual countries still matters.
How much does the cost of producing pork vary from one country to another, and what factors contribute to their relative advantage or disadvantage in a global market?
I recently had the opportunity to collaborate with Drs. Lee Schulz and Dermot Hayes in the Department of Economics at Iowa State University to address this question2.
The analysis of productivity, costs, and returns are for 2018 using data primarily from Interpig, an international benchmarking network.
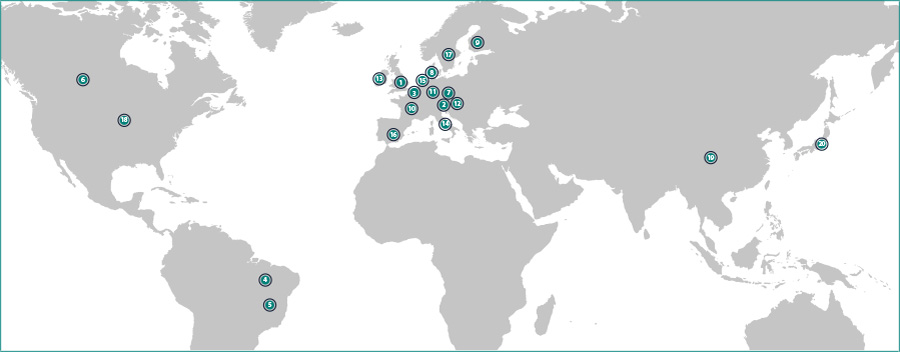
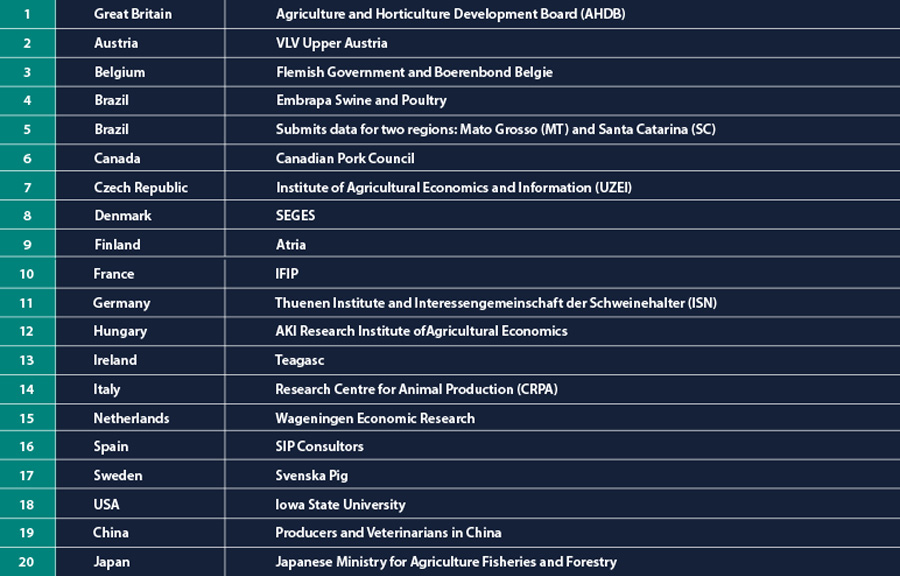
The representatives of the seventeen participating countries in Europe, North America, and Brazil come from scientific institutions and extension services of producer organizations. The InterPIG data is updated annually and represents a countrywide average performance of representative farms in each country. In addition to the information from InterPIG, data for Japan and China, two key pork importing countries in Asia, were obtained with the help of MSD Animal Health technical and marketing staff. The data for Japan was from the Japanese Ministry for Agriculture Fisheries and Forestry, and the data for China was from producers and veterinarians and represented costs and productivity for modern, large-scale, single-story, non-filtered swine farms that were free of ASFV.
The estimated cost of production from breed-to-market in 2018 ranged from US$3.65 per kg of carcass weight sold in Japan to US$1.11 per kg of carcass weight sold in the state of Mato Grosso of Brazil, a difference of US$2.54 between the highest and lowest cost countries (Figure 1, bars).
The line in Figure 1 represents the market pig price or revenue on a per kg of carcass weight basis. The difference between the top of each stacked bar (total cost) and the line (revenue) represents the profit in each country.
Figure 1. Cost of production and revenue for each country (US$ per kg of carcass weight), breed-to-market.
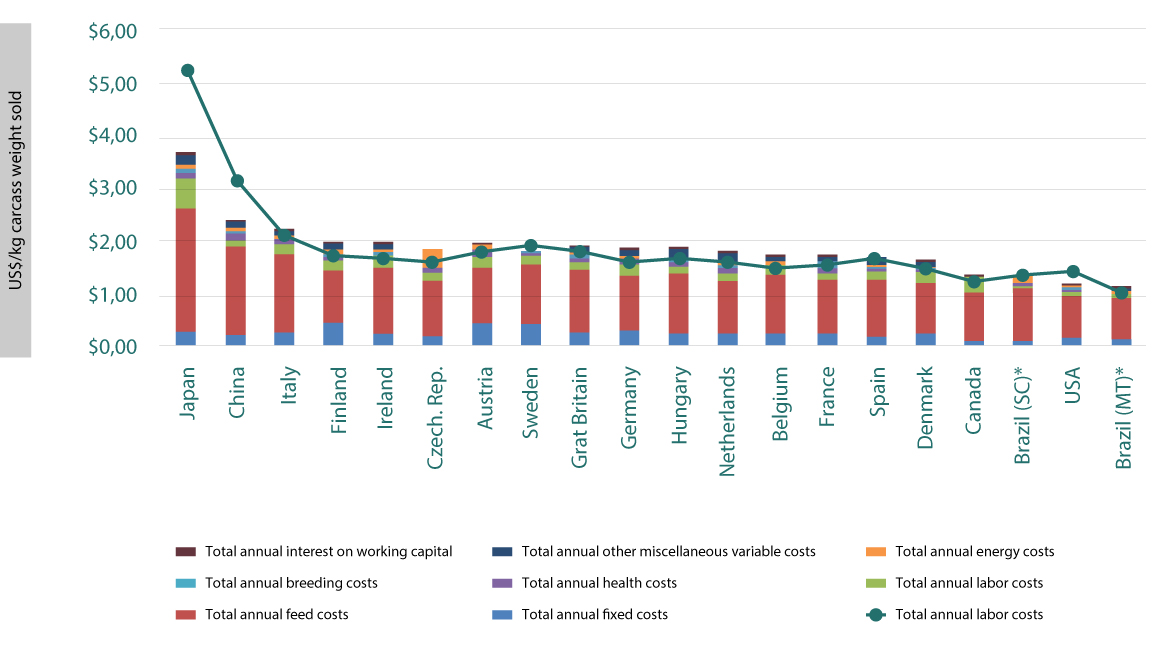
*Brazil has two data points because of the large differences that exist between the traditional hog farming areas of Santa Catarina and the new frontier in Brazilian pork production, Mato Grosso.
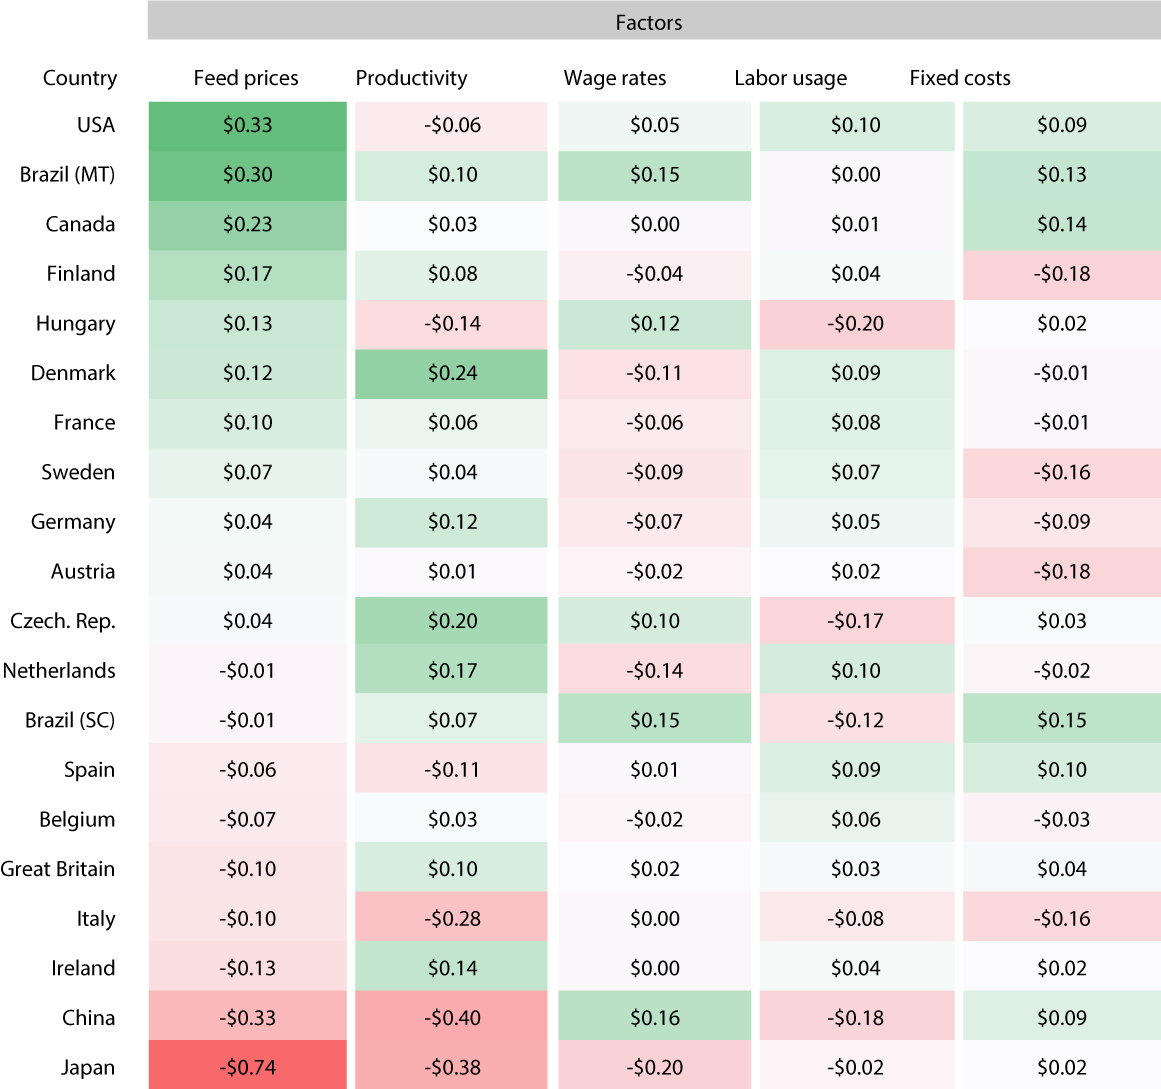
What are the major factors that give each country a competitive advantage or disadvantage? To answer this question, we set all of the values used to estimate productivity, costs, and revenue for each country at the same value, the average value for all countries. The only value(s) that varied for each country was those for the factor evaluated. Each factor was evaluated alone, one-at-a-time. Any differences in profitability, therefore, were due strictly to the country differences in the values for the factor evaluated. The relative advantage or disadvantage in profitability for the factors are shown in Table 1.
Producers in Japan have the highest feed prices giving them a US$0.74 per kg of carcass weight disadvantage to a country with average feed prices and a US$1.07 disadvantage to producers in the USA with the lowest feed prices.
After feed prices, country differences in productivity is the next largest contributor to why countries are at a competitive advantage or disadvantage to others. Higher productivity in Denmark and several other countries in Europe contributes positively to their competitiveness. Higher productivity in Denmark gives producers there a US$0.24 per kg of carcass weight advantage over a country with average productivity and a US$0.62 per kg of carcass weight advantage over Japan with the lowest productivity. Differences in wage rates, labor usage, and fixed costs, which are primarily a function of building costs, also contribute significantly to the relative competitive position of each country but to a lesser extent than feed prices and productivity.
Table 1. Relative advantage or disadvantage in profitability for each factor (US$/kg carcass weight), breed-to-market.
References
1. United States Department of Agriculture (USDA), Foreign Agricultural Service (FAS). Livestock and Poultry: World Markets and Trade. July 10, 2020.
2. Holtkamp D.J., Hayes D. J., Schulz L.L. Key Performance Indicators in Pork Production: An International Comparison. MSD Animal Health. August 1, 2020.